Axiom
Monitor everything. Store everything
5 colors
17 components
Inter, SF Mono
Apr 16, 2026
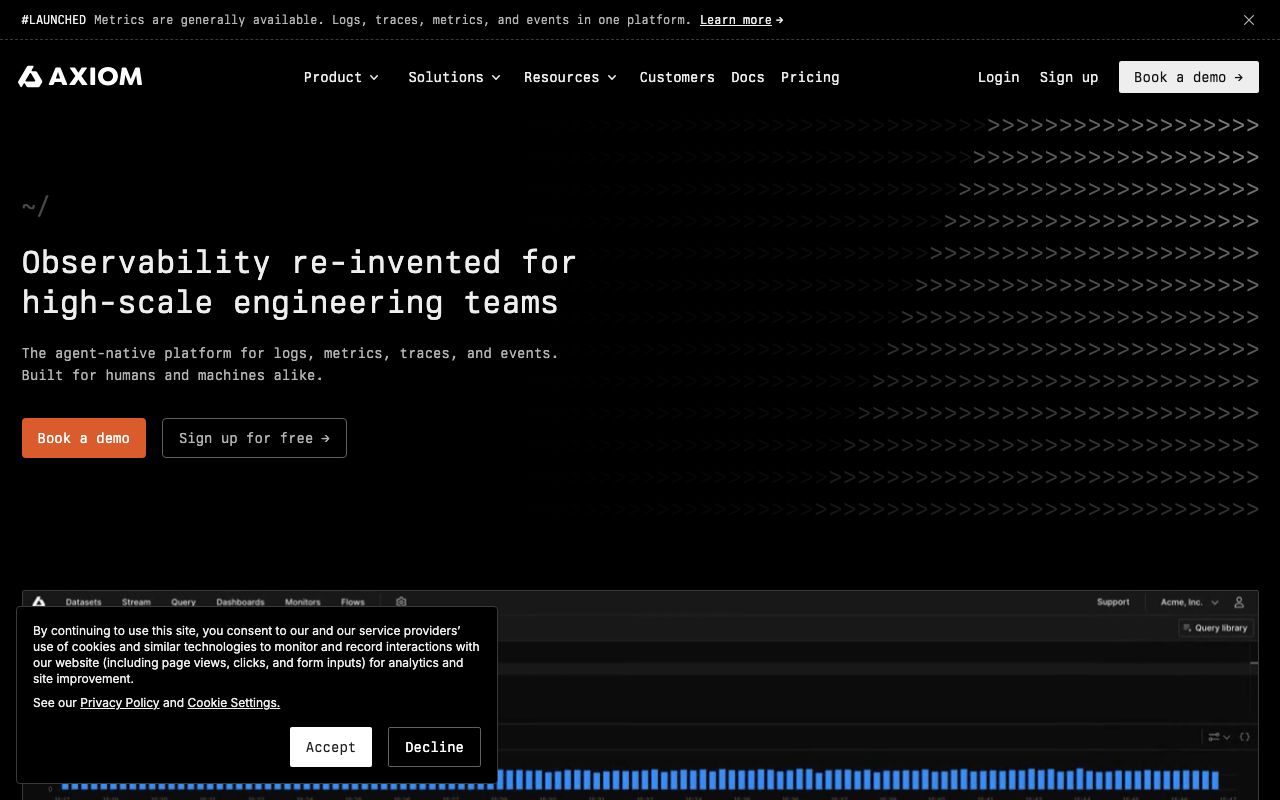
Website Preview
Colors
Primary
#AE4DFF
Purple accent, CTAs
#0B0C0F
Background
#FFFFFF
Primary text
#1C1D22
Cards, panels
#8B8D97
Secondary text, borders
Typography
Inter
Role
SizeWeightHeight
Display
36px700—
Heading
22px600—
Body
14px400—
SF Mono
Role
SizeWeightHeight
Code
13px400—
DESIGN.md — Axiom
Overview
Axiom's design system embodies the observability space with a vivid purple accent on deep dark surfaces. The design is built for monitoring dashboards where data density is high and scanability is critical. Purple serves as the primary brand differentiator in a market dominated by blues and greens.
Colors
Primary Palette
| Token | Hex | Usage |
|---|---|---|
color-brand | #AE4DFF | Purple accent, CTAs |
color-bg | #0B0C0F | Background |
color-text | #FFFFFF | Primary text |
color-surface | #1C1D22 | Cards, panels |
color-muted | #8B8D97 | Secondary text, borders |
Typography
| Role | Family | Size | Weight |
|---|---|---|---|
| Display | Inter | 36px | 700 |
| Heading | Inter | 22px | 600 |
| Body | Inter | 14px | 400 |
| Code | SF Mono | 13px | 400 |
Components
Log Stream
- Real-time scrolling log viewer
- Color-coded severity: debug (gray), info (blue), warn (yellow), error (red)
- Click-to-expand with structured field view
APL Query Bar
- Full-width query input with syntax highlighting
- Auto-complete for dataset names and fields
- Time range selector (15m, 1h, 24h, 7d, custom)
Dashboard Tile
- Configurable chart (line, bar, heatmap, table)
- Drag-to-resize and reposition
- Purple accent on selected/active tile
Do's and Don'ts
Do
- Use severity colors consistently across all log and trace views
- Keep purple for brand and interactive elements only
- Show timestamps in the user's local timezone by default
Don't
- Don't use purple for severity levels — it's the brand color
- Don't truncate log messages without an expand option
- Don't auto-refresh dashboards faster than 5-second intervals